

Trends in the hose industry’s pricing fluctuate every quarter. The Producer Price Index (PPI) data presented here provide a snapshot of pricing trends for five common industrial product groups. This report provides a national benchmark and comparison of the latest quarterly data alongside the previous quarter of 2019 and the same quarter in 2018. It represents trends in selling prices received by domestic producers and is a good barometer for inflationary pressures felt at the wholesale level.
Provided by NAHAD, the Association for Hose and Accessories Distribution.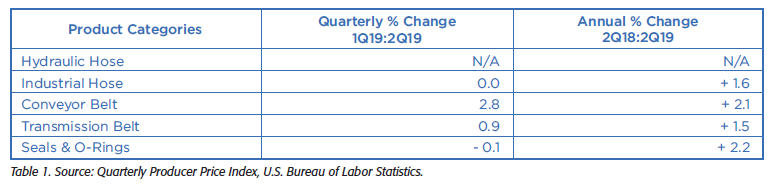
 During the second quarter of 2019, most rubber products experienced a relatively small growth of selling prices at the domestic producer level. Other product categories steadied, except for the Conveyor Belt category which increased by 3% from the previous quarter. All products showed an
increase from the previous year, see Table 1.
Hose – Hydraulic/Industrial Products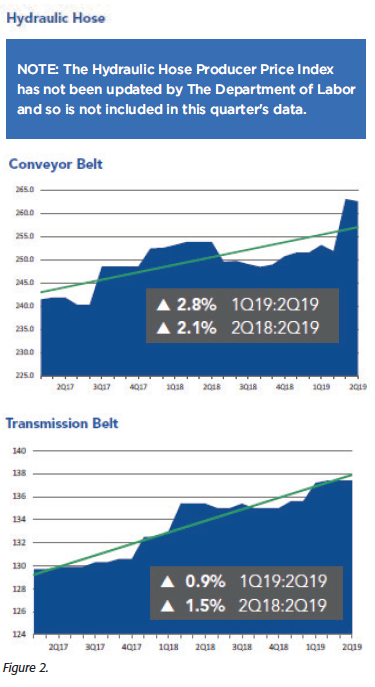
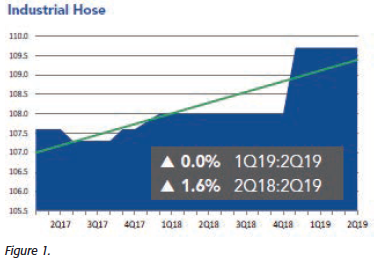
The hydraulic hose category is defined by the U.S. Bureau of Labor Statistics (BLS) as all other hydraulic/pneumatic hose products, and the industrial hose category covers industrial
rubber/plastic hose products. The Industrial Hose Price Index remained flat throughout the second quarter of 2019, following a spike at the end of 2018. Another data set typically observed is the Hydraulic Hose Producer Price Index, but it has not been factored into this article due to out of date data, see Figure 1.
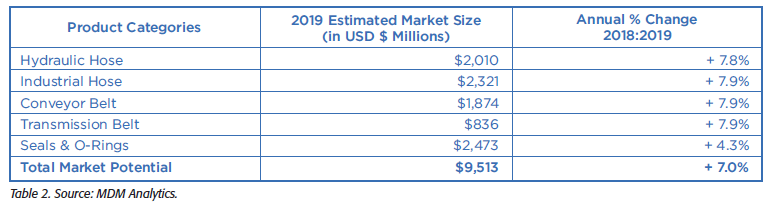
Belt – Conveyor/Transmission Products
The conveyor belt group contains all flat rubber and plastic belts/belting. Transmission belts also include rubber and plastic belts/belting, and also motor vehicle rubber and plastics for belting, but does not include the flat rubber. Whereas hose pricing for hoses remained flat, the pricing for the conveyor belt category increased significantly into the second quarter of 2019. Nearing the end of the quarter, the category started to taper off from its large increase. In comparison, the transmission belt pricing increased only slightly from the first
quarter of 2019 and continued to stay flat, see Figure 2.
Seals & O-Rings
The seals and O-Rings category covers a large range of products. BLS defines the group as packing and sealing devices, which includes compression packings, molded packing and sealing devices, rotary oil seals, and axial mechanical face seals and parts. In opposition to hoses and belts, the seals and O-Rings pricing index steadily decreased throughout the second quarter of 2019. When looking between 2018 and 2019, however, the pricing index steadily increased, but at a less steep rate than seen above, see Figure 3.
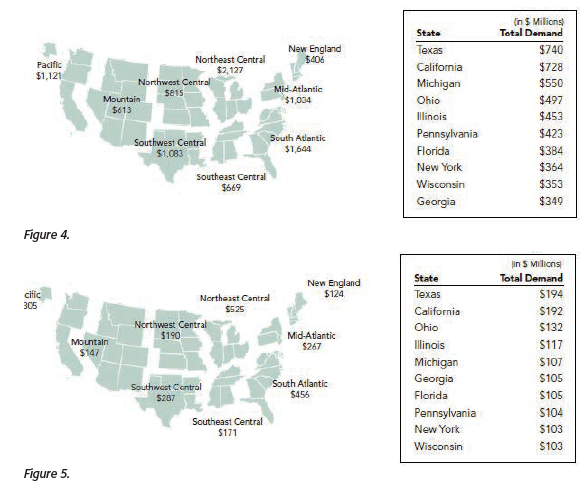
Annual Market Size – Rubber Products
The annual market size rose 7.0% into 2018 for the five industrial product categories examined in this report and is estimatedat $9.5 billion. Demand for all five of the product categories has increased year-to-year, reflecting overall trends across
industrial production indicators for key customer segments in mining, energy, industrial and construction markets. The overall Industrial Production Index, a key measure of U.S. manufacturing
activity, showed an increase in 2018 and into 2019.
Annual Market Size – Regions/Top 10 States
The national rubber products market size now equals roughly USD $9.5 billion, see Figure 4.
All of the market size analysis in this report is based on the five product categories discussed above. The data reflect estimates of end-use consumption, on an annual basis in U.S. dollars, for maintenance, repair, and operations (MRO) and original equipment manufacturer (OEM) business segments.
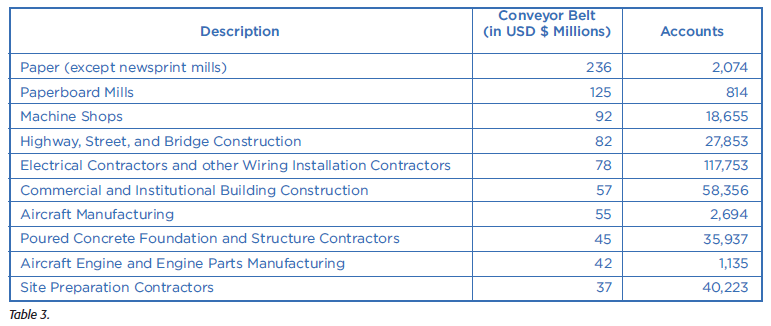
Annual Market Size – Top 10 Customer Segments for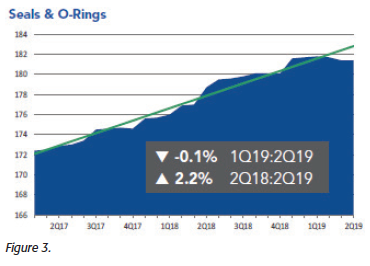
Conveyor Belt Products
The top ten customer segments include paper, paperboard mills, machine shops, electrical contractors and other wiring installation contractors, among others. Table 3 shows the
breakdown of customer segments and the annual market size.
Market Size Profile – Seals & O-Rings
The size of the U.S. Seals & O-Rings market is approximately $2.5 billion, according to estimates made by MDM Analytics, see Figure 5. The profile shows how demand for Seals & O-Rings is segmented regionally, across the top 10 states by demand, and the top 10 customer sectors that consume Seals & O-Rings, which account for 26% of the total market size. Market size is defined as the total available market at the enduser customer level, including a distributor margin estimate, to provide a “street” price estimate, in U.S. dollars.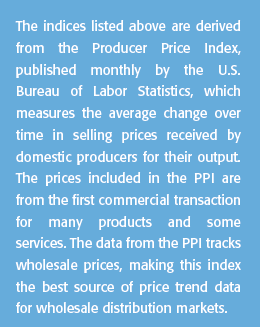
Final Thoughts
Consumption rates for MRO products at a given account location are largely driven by the type of manufacturing or unique industry-sector processes and number of employees at a location. This demand relationship can be used to model market potential for defined territories at the county level and higher based on a territory’s unique composition of industries and the number of employees in those industries. MDM Analytics’ proprietary statistical model segments the national demand for each product category based on its unique historical consumption patterns by each 6-digit NAICS industry sector. Then the total employment of each industry is divided into the total annual market size to arrive at the dollar-per-employee ratio. Market potential can then be estimated by modeling the types of end-market industries and their size in a given territory. In effect, the “DNA” of a territory and its estimated consumption patterns for defined industrial product categories can be estimated.